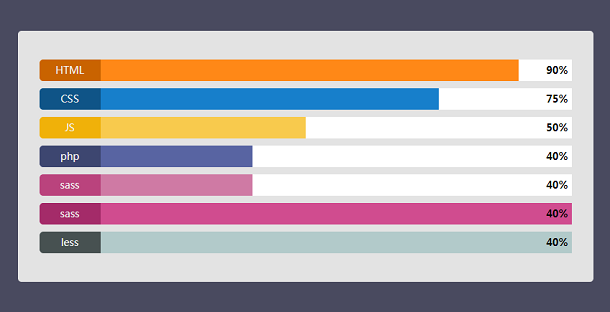
Today we introduce to you a horizontal column statistical chart based on HTML5 and SVG. Its characteristic is that each data group has a different color representation, and each group of data has a different percentage to represent. The chart has the animation effect of the progress bar when it is initialized, so you can also use it as a progress bar.
Advertisement
<div class="container">
  <div id="skill">
	<div class="skillbar html">
	  <div class="filled" data-width="90%"></div>
	  <span class="title">HTML</span>
	  <span class="percent">90%</span>
	</div>

	<div class="skillbar css">
	  <span class="title"></i> CSS</span>
	  <span class="percent">75%</span>
	  <div class="filled" data-width="75%"></div>
	</div>

	<div class="skillbar js">
	  <span class="title">JS</span>
	  <span class="percent">50%</span>
	  <div class="filled" data-width="50%"></div>
	</div>

	<div class="skillbar php">
	  <span class="title">php</span>
	  <span class="percent">40%</span>
	  <div class="filled" data-width="40%"></div>
	</div>

	<div class="skillbar sass">
	  <span class="title"></i> sass</span>
	  <span class="percent">40%</span>
	  <div class="filled" data-width="40%"></div>
	</div>

	<div class="skillbar indesign">
	  <span class="title"></i> sass</span>
	  <span class="percent">40%</span>
	  <div class="filled" data-width="400%"></div>
	</div>

	<div class="skillbar">
	  <span class="title"></i> less</span>
	  <span class="percent">40%</span>
	  <div class="filled" data-width="400%"></div>
	</div>
  </div>
</div>
* {
  margin: 0;
  padding: 0;
  box-sizing: border-box;
}

*:before, *:after {
  box-sizing: inherit;
}

body {
  width: 800px;
  margin: 50px auto;
  font-family: "Open Sans", sans-serif;
  font-size: 14px;
}

#skill {
  width: 100%;
  background-color: #e3e3e3;
  padding: 30px;
  display: block;
  border-radius: 5px;
  margin: auto;
}

h2{
  margin: 20px;
  text-align: center;
  font-weight: 700;
}
$(document).ready(function () {
    $('.skillbar').skillbar({
        speed: 1000,
    });
});
Advertisement