Recently, we just shared a hexagonal loading animation implemented by pure CSS3. This idea of using geometric graphics to achieve Loading animation is still good. What we want to share this time is also a Loading animation based on pure CSS3, which consists of 2 luminous lines that rotate in reverse. This luminous animation looks even more beautiful on a black background.
We know that CSS3 can be used to create a lot of cool 3D animation effects. For example, a CSS3 menu to be shared this time. It takes advantage of some features of CSS3 to realize the 3D animation effects when the menu is expanded. When the mouse is over the menu item, the menu item will also show a glowing effect, so that the overall visual effect is better and three-dimension…
The advantage of Canvas is that it allows you to draw any graphics on the drawing board. The advantage of SVG is that it can easily draw paths of various shapes on the web page. Today I will share with you a colorful kaleidoscope animation based on HTML5 Canvas and SVG. The colorful path will continuously change shape and color, and the effect is very cool.
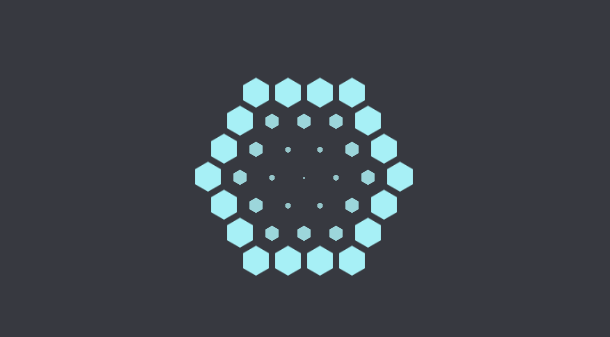
We have shared a lot of CSS3 Loading animations with different styles before. This time we bring you another hexagonal loading animation based on pure CSS3. The characteristic of this Loading animation is that there are many small hexagons combined into a big six. Hexagons, the combination of small hexagons and large hexagons is switched continuously while waiting for loading.
In modern web pages, we can often find the "Like" button on some article, video, and picture pages, and click the button to indicate whether we like or dislike the content. Most "Like" buttons are plain text buttons or image buttons. If you want them to have special animation effects, then we need to use CSS3 or JavaScript. This article brings you a Like but…
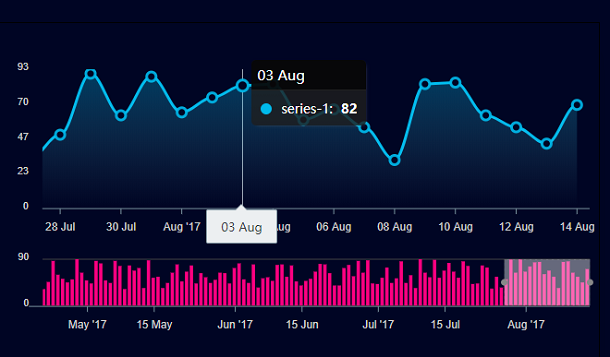
ApexCharts is a modern chart library based on JavaScript and HTML5 with very powerful functions. The curve chart to be shared today is based on ApexCharts. The chart is finally displayed on the browser in the form of SVG. Another feature of this chart is that you can customize the range of selected data. After the range is determined, the graph and the bar graph in the range ar…